User Composition Report
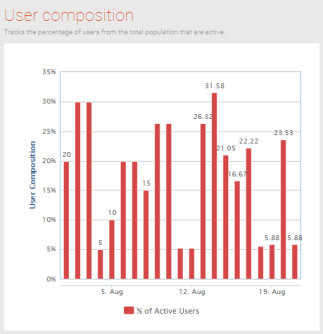
The User Composition report displays the percentage of your audience that is actively using the program. It helps you understand the overall adoption of a tool or portal. The formula for calculating user composition is: number of active users for the day/week/month/quarter/year, divided by active users for the same day/week/month/year minus 90 days from the end of the day/week/month/year.
- Open Nitro Studio > Analytics > Quick Insights > Adoption tab.
- Note the data available date on the right side of the title bar. Data after this date is not yet available and is not included in reports.
- Interact with the data using dates, drilldowns, filters, hovers, and zoom.
- To interpret the data and compare it to your goals and program structure:
- What percentage of active users are interacting with the program?
- Is user activity increasing, decreasing, or remaining steady?
- For new programs, use the data to set benchmarks on behavior.
See also