Interact with Quick Insights Reports
Quick Insights provides an interactive view of your data within standard reports. You can work with this data in many ways.
Dates
Verify the data available date at the top right side of the view. Data after this date is not yet available and is not included in the reports.
A report's dates are grouped and updated automatically based on your selected report timeframe. The following logic is used to determine the date groups and labels on the horizontal axis.
Days are calculated by comparing the start date and end date.
- Less than 28 days - Graph displays in days.
- 28-83 days - Graph displays in weeks.
- 84-364 days - Graph displays in months.
- 365-1094 - Graph displays in calendar quarters.
- Greater than 1094 days - Graph displays in years.
Filters
Filters are global to all reports on the Quick Insights dashboard. Filters limit your data to only show the records that are related to the group names and values that you select. Use filters when you want to restrict the amount of data you will see in the graphs.
- Click Add filter (
 ).
). - Select a filter in the left pane and then select the corresponding item in the right pane.
- Click Apply. Applied filters appear at the top of the list in the left pane and to the left of the Apply button.
- Add additional filters as necessary.
- Click delete (
 ) next to the filter to remove it.
Drilldowns
Drilldowns break down the display of your data by one single group or segment. For example, if you have a segment (income) with several possible values (0-10K, 10K-40K, 40K-90K) and you choose to drill down, the graph will display each one of the possible values in different colors. The total will be the total of all your users, but you can see how many are in each range. Use drilldowns to further break down, by value, one and only one of the multiple groups or segments you have partitioned your data into.
Note: Using both drilldowns and filters is possible, but when you filter your data, it makes sense to drill down on one of the values you selected as your filter.
- Click Add drilldown (
 ).
). - Select the drilldown from the drop-down list. If this list does not contain the items you expect, you may need to configure additional groups or segments.
- The Groups list is populated from values created in the Group Management view or via /groups or /group-classes APIs.
- The Segment list is populated with group classes that have been defined as a segment.
- Click delete (
 ) to remove a drilldown.
Hovers
To manage the data that displays in the report, you can:
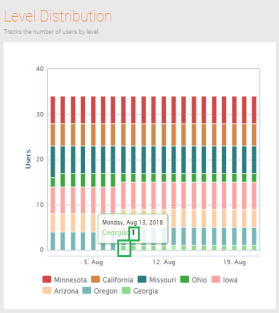
- Hover over the report to show more details about that section. This is particularly helpful when multiple items stack on top of one another. Show me

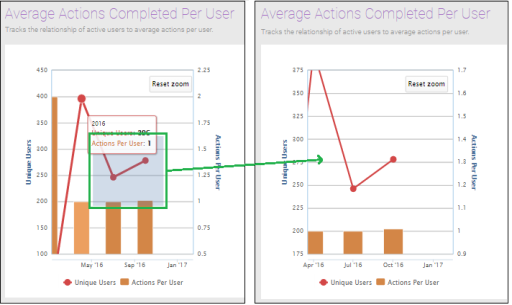
- Click and drag over an area in the report to zoom in on that area. Click Reset zoom to return to normal view. Show me
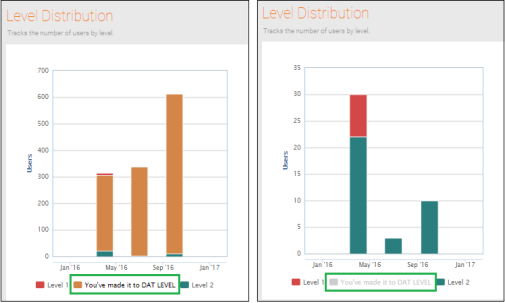
- Click items in the legend to add and remove them from the report. Show me
See also