Level Distribution Report
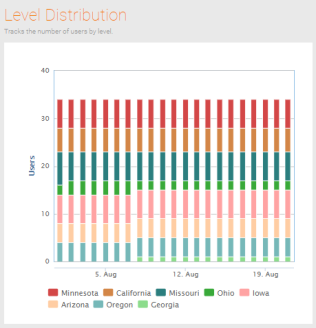
The Level Distribution report tracks the progress of users within each level. It helps you identify drop-off points in your program. The report calculates the level a user is in at the time the report is generated. A snapshot count of how many users are in each level is taken weekly and that snapshot is used for historical data (historical data is not calculated).
- Open Nitro Studio > Analytics > Quick Insights > Points & Levels tab.
- Note the data available date on the right side of the title bar. Data after this date is not yet available and is not included in reports.
- Interact with the data using dates, drilldowns, filters, hovers, and zoom.
- To interpret the data and compare it to your program structure:
- Are users progressing through your defined levels?
- Are users stuck at a particular level?
- Is your leveling structure too easy or too hard?
See also