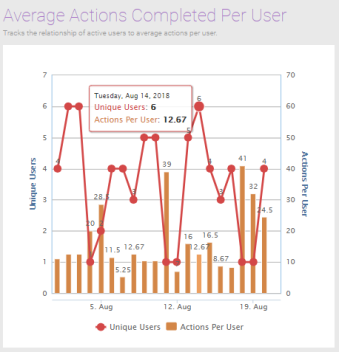
Average Actions Completed Per User Report
The Average Actions Completed Per User report tracks the adoption of your program. You can use this report to quickly determine if your user population and their activity is growing.
- Open Nitro Studio > Analytics > Quick Insights > Engagement tab.
- Note the data available date on the right side of the title bar. Data after this date is not yet available and is not included in reports.
- Interact with the data using dates, drilldowns, filters, hovers, and zoom.
- To interpret the data and compare it to your goals and program structure:
- Compare the users to actions to determine if users are just logging in once per day or actively engaging with the program.
- Understand if users are loyal to the program by sustained activity in completing actions.

See also